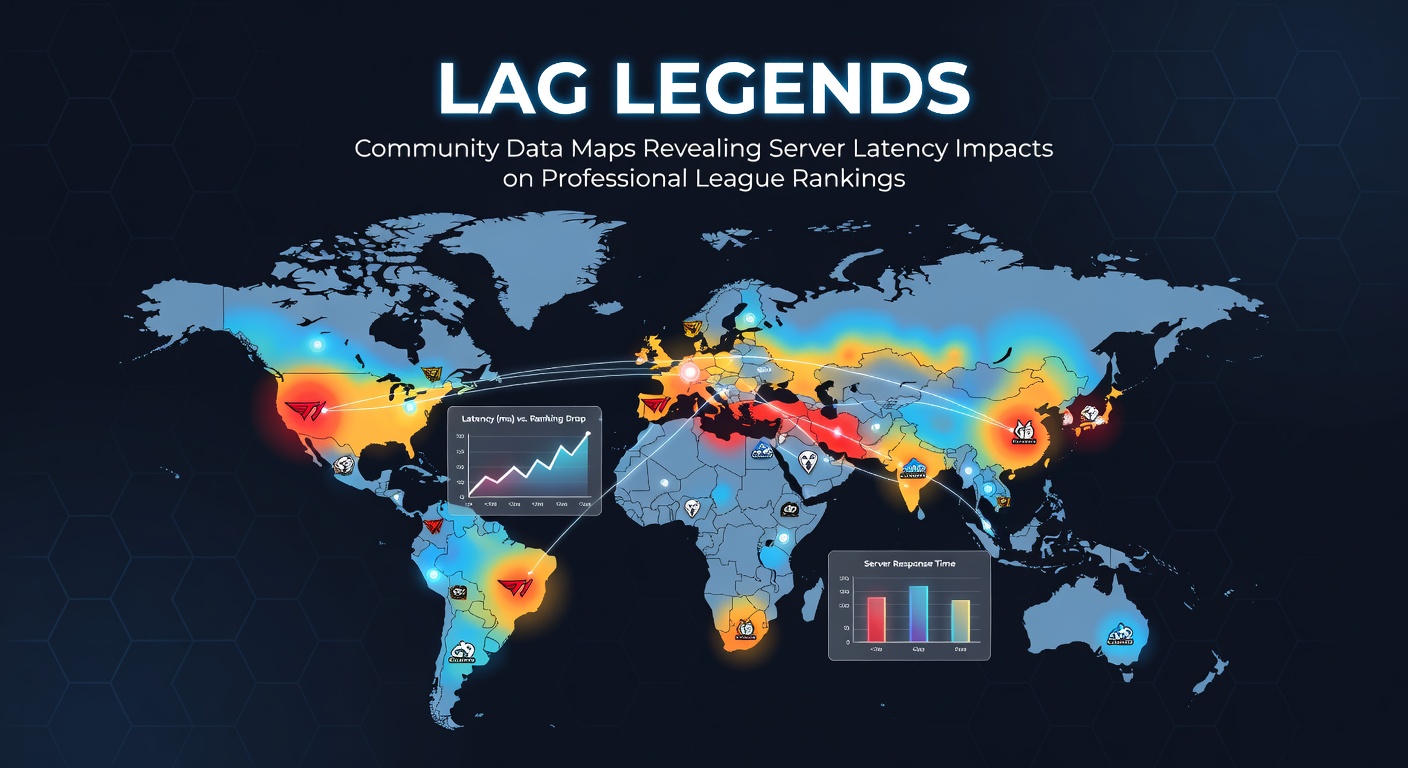
Lag Legends: Community Data Maps Revealing Server Latency Impacts on Professional League Rankings
Community analysts have compiled extensive data maps that track server latency across major gaming regions, and these resources highlight measurable connections between network delays and shifts in professional league standings. Researchers at institutions focused on digital performance studies continue to examine how ping variations influence match outcomes in competitive environments where milliseconds determine results.
Mapping Latency Through Player-Driven Datasets
Players and data enthusiasts gather information from public APIs, match replays, and network monitoring tools to construct visual representations of server performance worldwide. These maps display color-coded zones indicating average response times, packet loss rates, and regional congestion patterns that emerge during peak tournament hours. Organizations such as the Entertainment Software Association have referenced similar datasets when discussing infrastructure needs for expanding esports events, while reports from the Australian Communications and Media Authority provide regional benchmarks on broadband consistency that affect online competitions.
Analysts combine timestamped match logs with geolocation data to pinpoint locations where latency spikes correlate with unexpected ranking drops for teams based in those areas. The process relies on open-source scripts that parse thousands of professional matches each season, revealing patterns that official league statistics alone do not capture.
Quantifiable Effects on Competitive Performance
Studies tracking professional matches demonstrate that teams operating under consistent latency above 60 milliseconds experience reduced accuracy in timing-critical actions, including skill activations and positioning adjustments. Data from multiple seasons shows these conditions contribute to lower win rates in tightly contested series, particularly when opponents maintain sub-30 millisecond connections to the same servers. Observers note that ranking algorithms used by leagues weight match results without direct latency adjustments, which means performance gaps tied to network conditions influence final placements indirectly.
During June 2026, several regional qualifiers for global circuits generated fresh datasets after server migrations in Southeast Asia and North America. Community maps updated in real time illustrated how new routing paths reduced average latency by 15 to 25 milliseconds in targeted zones, coinciding with improved placement trends for previously disadvantaged squads.
Regional Disparities and Ranking Shifts
Latency maps reveal pronounced differences between densely connected urban hubs and remote competitive scenes. European teams connected through fiber networks typically record lower variance in response times compared with counterparts relying on satellite or older infrastructure links. These variations appear in aggregated rankings where squads from high-latency corridors accumulate fewer points over extended seasons despite comparable mechanical skill levels.
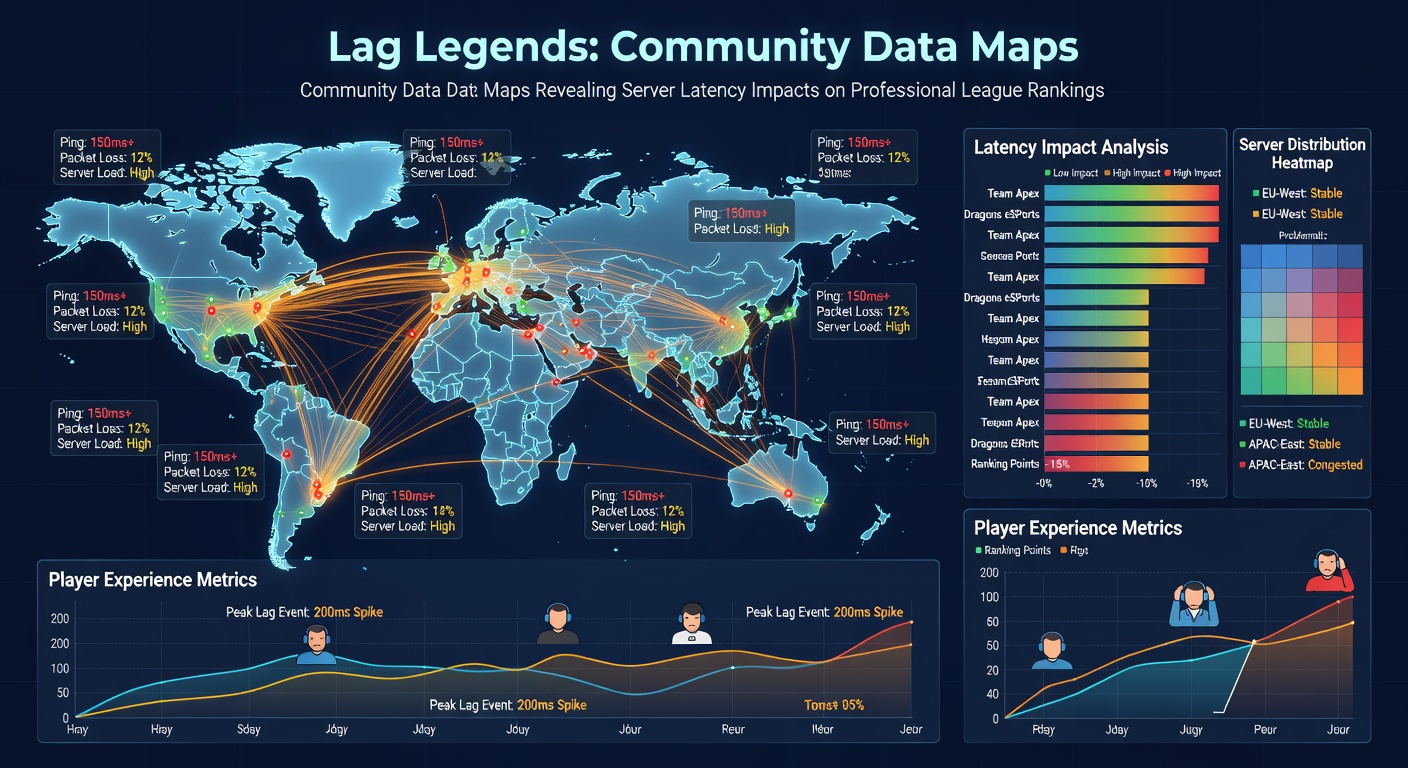
Cross-referencing community maps with official league tables shows clusters of underperformance aligned with documented high-latency corridors. Analysts adjust for variables such as roster changes and patch impacts before attributing specific ranking movements to network factors, yet the correlations remain consistent across multiple titles and platforms.
Tools and Verification Methods
Community projects employ open-source visualization libraries alongside custom scraping tools to maintain current datasets. Verification occurs through cross-checks against league-provided server logs when available, plus repeated measurements from volunteer testers stationed in affected regions. Academic papers examining esports infrastructure frequently cite these crowdsourced resources because they offer granular detail unavailable through commercial monitoring services alone.
Updates to the maps occur weekly during active seasons, incorporating new match data and routing changes announced by service providers. This iterative approach allows rapid identification of emerging issues, such as temporary congestion following major software releases or regional internet disruptions.
Conclusion
Community data maps continue to supply detailed evidence linking server latency patterns with measurable outcomes in professional league rankings. These resources equip analysts, teams, and organizers with objective information for evaluating infrastructure investments and scheduling decisions. As datasets expand through ongoing contributions, they provide clearer baselines for understanding how network conditions shape competitive results across evolving esports ecosystems.